Accurate Daily Measurements of Core Web Vitals with Google Analytics
Have you ever optimised your website for the Core Web Vitals (CWV)? Did you want to check your changes the next day—but Google’s various tools don’t give you current daily CWV metrics due to the rolling 28-day window?
In this post I’ll review Google’s toolset for measuring CWV and explain how to see if your changes had any effect on CWV day by day with Google Analytics (GA).
Accurate daily CWV measurements: Create your report
3-step workflow to get your daily accurate CWV report.
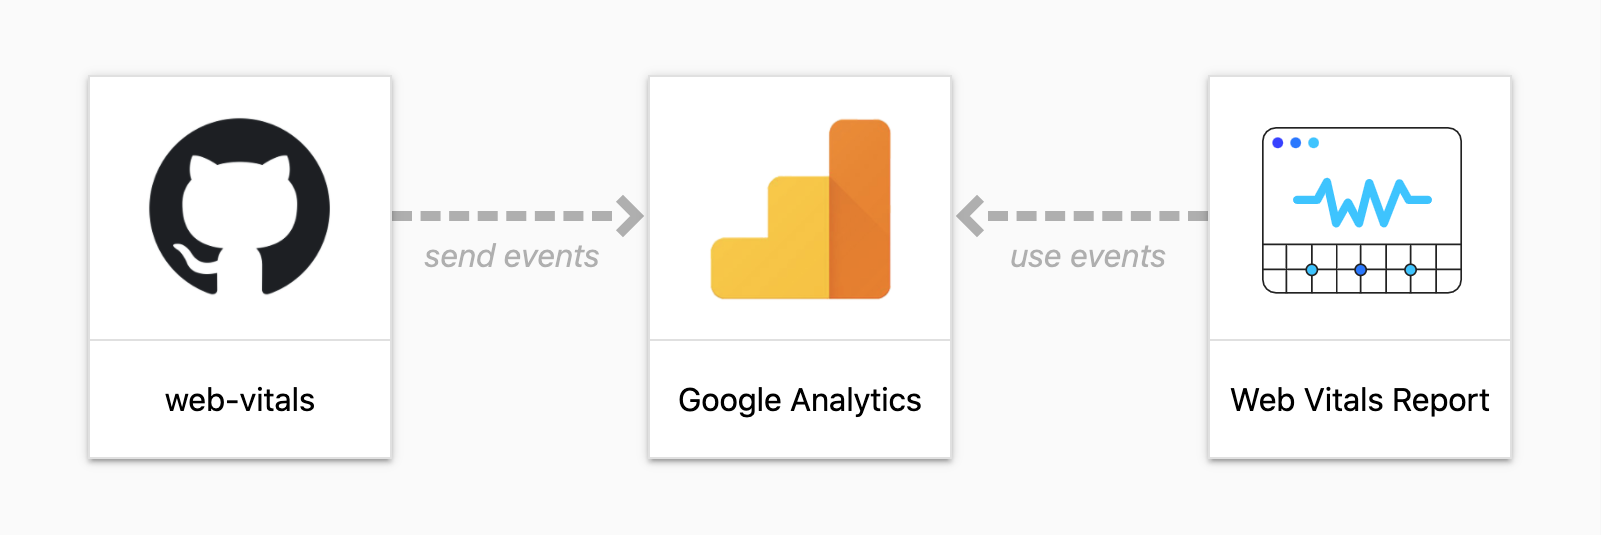
There isn’t a prebuilt view for daily accurate reports in any analytics service out of the box. That’s why we need to create our own report in three steps:
- web-vitals: to measure CWV metrics in the frontend
- CWV GA tracking snippet: to send these captured metrics over to GA
- Web Vitals Report: to create your CWV report by connecting your GA with this external reporting tool
The web-vitals library lets us grab all CWV metrics of each visitor of the site. These metrics are then sent off to Google Analytics. The external Web Vitals Report tool can then extract these tracking events from your GA account and create a daily accurate report.
Don’t be fooled: GA can display your CLS, LCP and other CWV metrics when you search for these events. But they’re inaccurate in the GA events view. For instance it’s possible that multiple CLS events are sent, each with their own delta value that accumulates to the total CLS. You’d need to group by that day and url and user to get an accurate reporting. This grouping isn’t supported out of the box.
That’s why Google created the external tool Web Vitals Report. You can connect your GA account with it and it will extract the data. If you followed the default naming inside of the CWV GA tracking snippet, everything will work out of the box. You’ll be rewarded with shiny graphs and an accurate* report overall.
*) GA imposes a limit in each report which can lead to sampling and an inaccurate report.
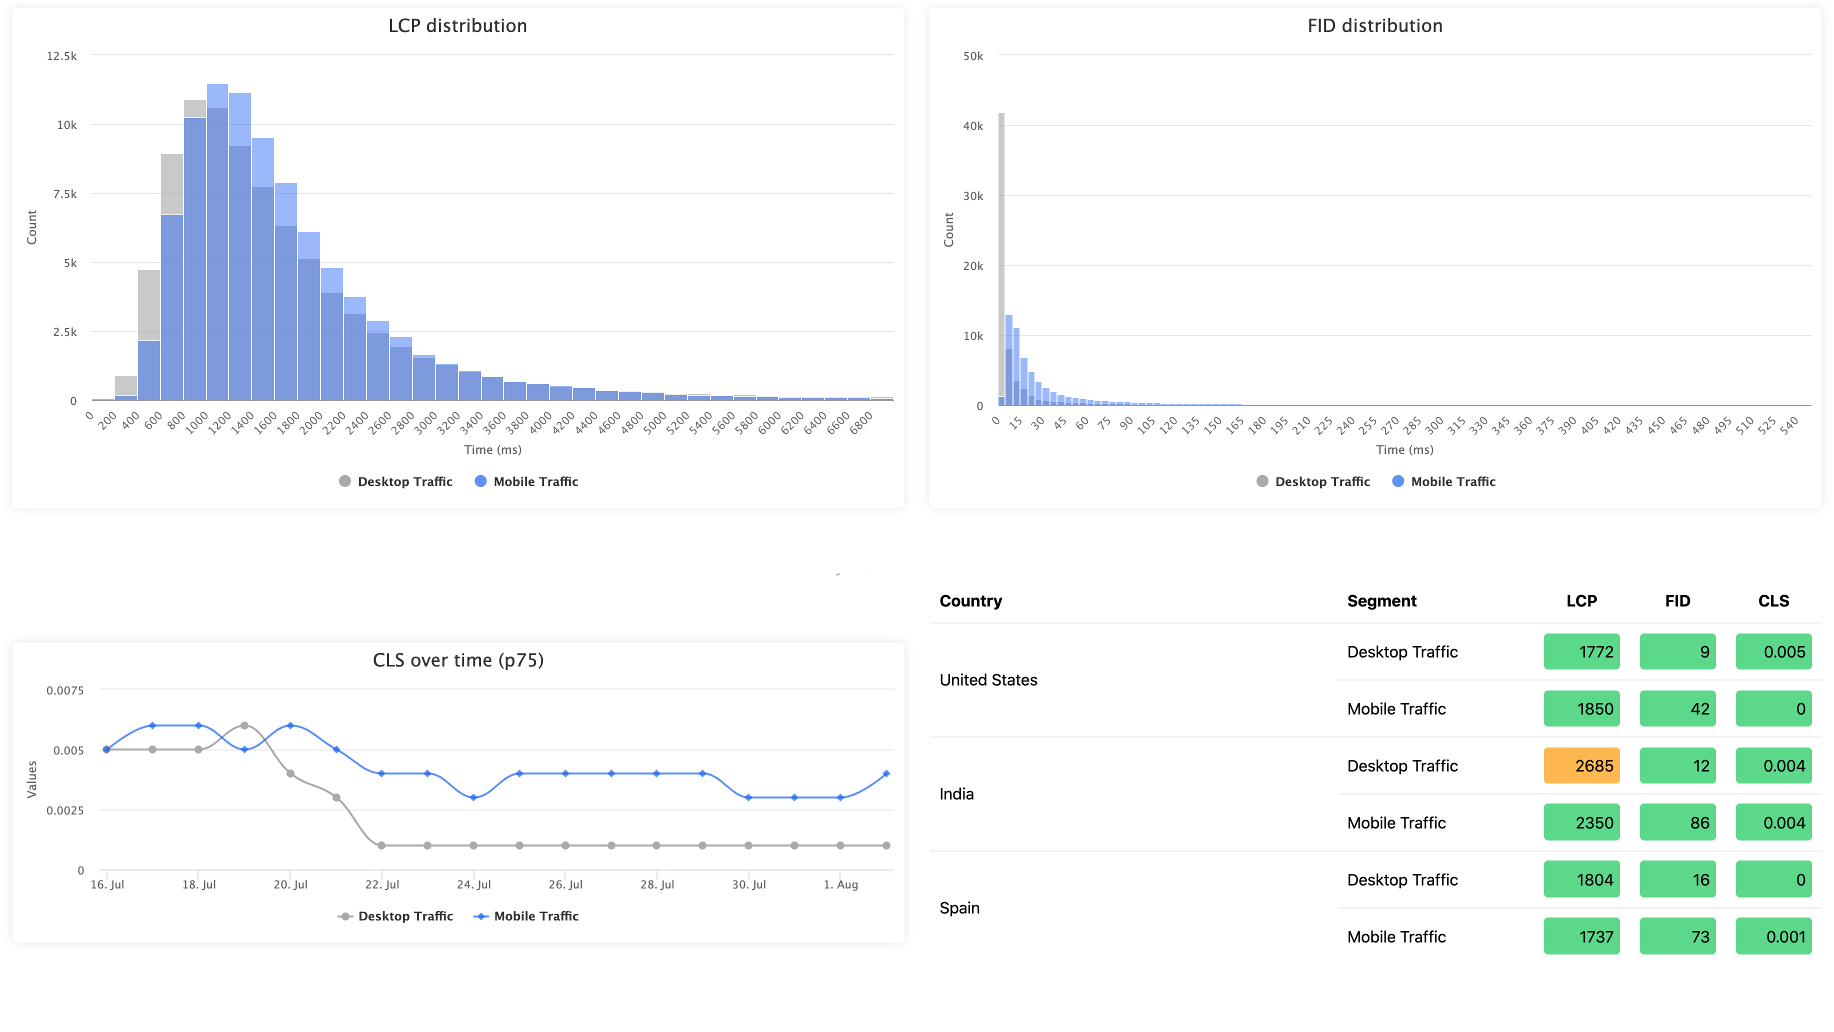
Core Web Vitals reports are a great way to group metric by day and overall break downs.
The screenshot above is an excerpt of the Web Vitals Report with daily accurate Core Web Vital metrics.
Inaccurate daily CWV measurements: Google’s tools
For daily CWV measurements we can’t rely on Google’s tools because they either aggregate over a long 28-day period or only measure single pages with synthetic, non Real-User Metrics (RUM). So it takes a lot of days to see any change within that period.
Still, Google provides a great—and very easy—overview of your CWV metrics to plan where to optimise next. But you can’t check the impact on CWV of your optimisation with these tools, e.g. the next day.
Field data aka real-user experiences:
- Google Search Console: measures similar pages
- PageSpeed Insights: measures a single page & all pages as a whole
- CrUX (Chrome UX Report): measures single pages & all pages as a whole
Lab data aka synthetic user experience:
- Lighthouse: measures a single page
- Chrome DevTools: measures a single page
- Web Vitals Chrome Extension: measures a single page
Rolling 28-day window explained
I dedicate a paragraph to this in particular because the rolling 28-day window appears many times in CWV measurement—especially in how the field data is measured.
Imagine you had 27 days of awful Cumulative Layout Shift (CLS) of 1.0 and on day 28 you magically fix it to 0.
At day 28 your average CLS would be 0.96—which would be rounded up to 1.0 again:
Days      | 1    2    3    4    5    6    7    8    9    10   11   12   13   14   15   16   17   18   19   20   21   22   23   24   25   26   27   28
-------------------------------------------------------------------------------------------------------------------------------------------------------
Daily CLS | 1.0  1.0  1.0  1.0  1.0  1.0  1.0  1.0  1.0  1.0  1.0  1.0  1.0  1.0  1.0  1.0  1.0  1.0  1.0  1.0  1.0  1.0  1.0  1.0  1.0  1.0  1.0  0.0
Average   | 1.0  1.0  1.0  1.0  1.0  1.0  1.0  1.0  1.0  1.0  1.0  1.0  1.0  1.0  1.0  1.0  1.0  1.0  1.0  1.0  1.0  1.0  1.0  1.0  1.0  1.0  1.0  0.96
In this example above your 1.0 to 0 CLS optimisation would take +23 days until you reach the allowed mobile CLS of 0.1.
See in the following table how slowly the average is decreasing:
Days      | +1   +2   +3   +4   +5   +6   +7   +8   +9   +10  +11  +12  +13  +14  +15  +16  +17  +18  +19  +20  +21  +22  +23  +24  +25  +26  +27  +28
-------------------------------------------------------------------------------------------------------------------------------------------------------
Daily CLS | 0.0  0.0  0.0  0.0  0.0  0.0  0.0  0.0  0.0  0.0  0.0  0.0  0.0  0.0  0.0  0.0  0.0  0.0  0.0  0.0  0.0  0.0  0.0  0.0  0.0  0.0  0.0  0.0
Average   | 0.9  0.8  0.8  0.8  0.8  0.8  0.7  0.7  0.6  0.6  0.6  0.5  0.5  0.5  0.4  0.4  0.4  0.3  0.3  0.3  0.2  0.2  0.1  0.1  0.1  0.0  0.0  0.0
More resources
- An In-Depth Guide To Measuring Core Web Vitals
- Google Forum: Explanation different data points in different tools
- Tracking Changes in Search Console’s Ore Web Vitals Report
If you found this post interesting please leave a ❤️ on this tweet and consider following my 🎢 journey about #webperf, #buildinpublic and #frontend matters on Twitter.
How did we turn 16k to 651k green URLs for more visibility by Google with #CoreWebVitals? ✅
— Simon Wicki (@zwacky) August 11, 2021
With this cycle of getting a quicker feedback loop:
1️⃣ Track & evaluate current daily measurements
2️⃣ Identify what metrics and pages to work on
3️⃣ Deploy
Read on for the what & how. pic.twitter.com/0hVZ9UnkND

Simon Wicki is a Freelance Developer in Berlin. Worked on Web and Mobile apps at JustWatch. Fluent in Vue, Angular, React and Ionic. Passionate about Frontend, tech, web perf & non-fiction books.
 Follow @zwacky