4 Very Useful Chrome Dev Tool Commands

$_ — last output
maybe you don’t want to store results in a variable for quick calculations and just want to chain those computations.
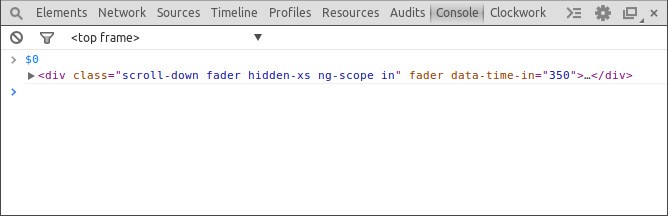
$0 — currently inspected element
useful if you want to output or alter the selected element.
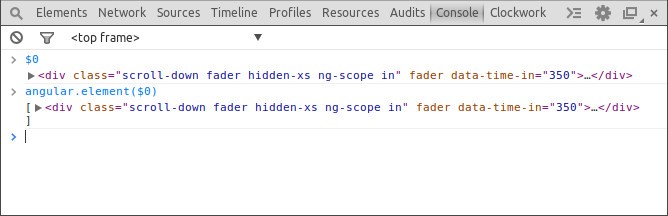
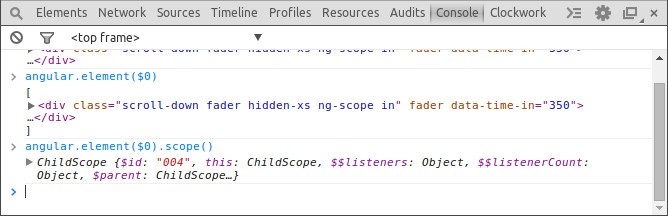
angular.element($0).scope() — get AngularJS’s scope
combined with $(0) this makes a great use to inspect a specific element and then check what it’s scope looks like.
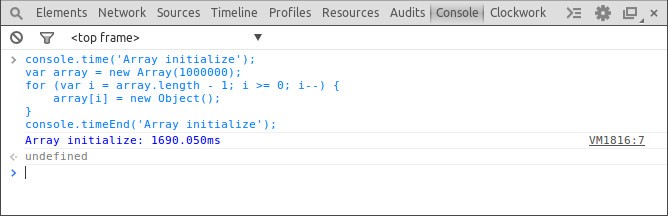
console.time(str) and console.timeEnd(str) — calculate the passed time
who hasn’t fiddled around with new Date(); or similar to profile a certain action in the code.
Just pass an identifyable string to each function call, so that the dev tools know where to start and to end.
The same is possible for CPU profiling using console.profile(msg) and console.profileEnd(msg).

Simon Wicki is a Freelance Developer in Berlin. Worked on Web and Mobile apps at JustWatch. Fluent in Vue, Angular, React and Ionic. Passionate about Frontend, tech, web perf & non-fiction books.
 Follow @zwacky